From satellite pixels to decisions you can defend
Every service runs on the same pipeline: public Earth observation data, indicators computed for your exact area, and checks that make the result auditable. You choose what you need out of it.
Act before the loss, not after it
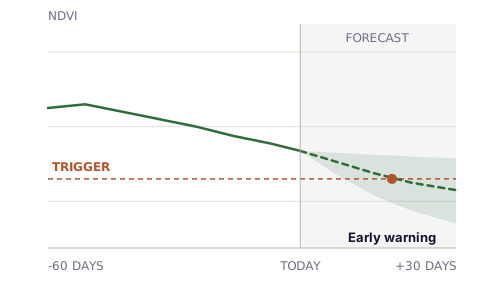
We track how vegetation and rainfall are moving in your area and flag when conditions are heading for a threshold that matters to you. That gives programmes time to release cash, adjust loan terms or prepare cover while it still helps.
- You get
- Early-warning signals for drought and excess rainfall, per area, with the threshold you care about
- Data
- Vegetation indices from NASA MODIS and Landsat and ESA Sentinel; rainfall from NOAA and JAXA sources
- Method
- Current readings compared with the area's own history to show how fast conditions are moving toward the threshold
- Delivered in
- Anticipatory cash transfers, Laikipia & Kajiado, 2023
A daily view of the land you are exposed to
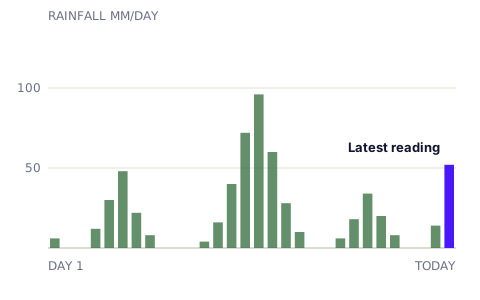
We feed more than 30 satellite and sensor data streams through our pipeline every day. You see vegetation, rainfall and land condition for the areas in your portfolio or programme, without hiring a remote sensing team.
- You get
- Daily indicator feeds by area, an interface to select an area and view NDVI and rainfall, and periodic reports for partners and funders
- Data
- 30+ satellite and sensor streams, plus drone and ground-sensor feeds where a project has them
- Method
- Indicators computed for each area's boundary, not for a whole county or pixel grid
- Delivered in
- MSME rainfall insurance with Fortune Credit, 2025
Evidence that a trigger fired, which anyone can check
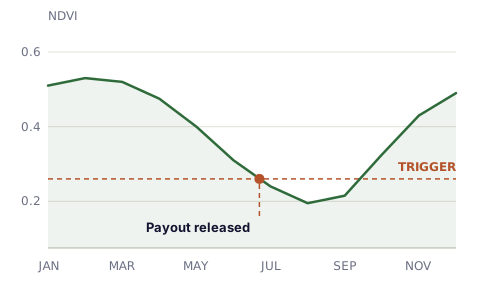
Parametric cover and outcome-based finance only work if every party trusts the trigger. We compute the signal, cross-check it, and publish the result with its evidence, so the payout or credit settles without a manual claim.
- You get
- An attested result for each trigger or practice, with the evidence stored where auditors can reach it
- Data
- The same satellite indicators, plus field data where the method needs it
- Method
- Signals checked across more than one source, results delivered directly to the contract or system that pays
- Delivered in
- Cattle herder insurance, 2022–2023 and smallholder carbon credits, Gatanga
- Satellite signalNDVI or rainfall computed for the insured or monitored area.
- Cross-checkCompared across sources and against the area's history.
- AttestationResult published with its evidence, open to audit.
- SettlementThe payout, loan adjustment or credit issues automatically.
Public data, so results can be reproduced
We build on public Earth observation archives. Anyone with the same inputs can check our numbers.
- Indicators
- Vegetation health (NDVI), rainfall, soil carbon, fire risk
- Streams
- 30+ satellite and sensor streams processed daily
- Field data
- Geotagged photos and measurements where a method needs ground truth